Following on from my previous posts looking at Remote Containers in Visual Studio Code, I wanted to take a look at debugging.
It turns out this is super straight forward; the configuration for debugging an application inside a container is exactly the same as if you were debugging locally, namely requiring a launch.json file be configured under the .vscode directory.
The example below is for a simple nodejs application:
{
    "version": "0.2.0",
    "configurations": [
        {
            "type": "node",
            "request": "launch",
            "name": "Launch Program",
            "skipFiles": [
                "<node_internals>/**"
            ],
            "program": "${workspaceFolder}/index.js"
        }
    ]
}
With this in place, simply start your application from either the 'Run' tab or the command palette (Shift + Ctrl + P, Debug), then set breakpoints as you please:
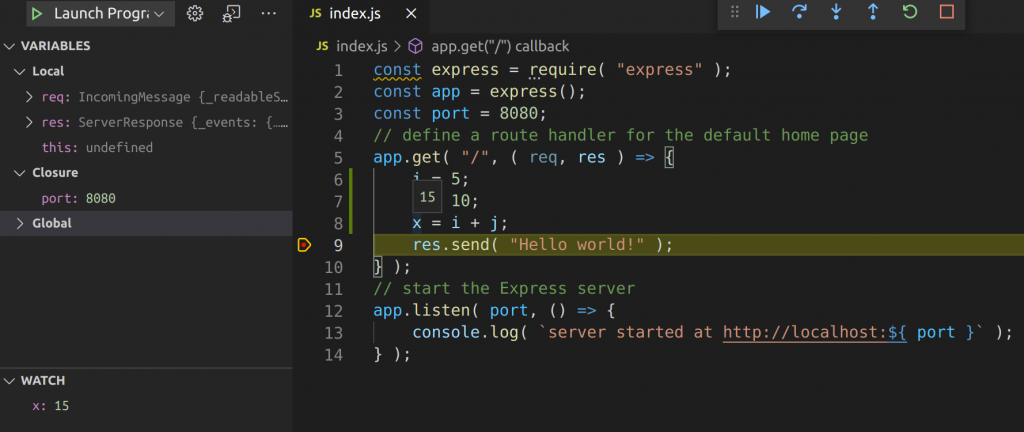
VS Code provides a full-blown debug environment, with breakpoints, code stepping, variable watches etc all supported.
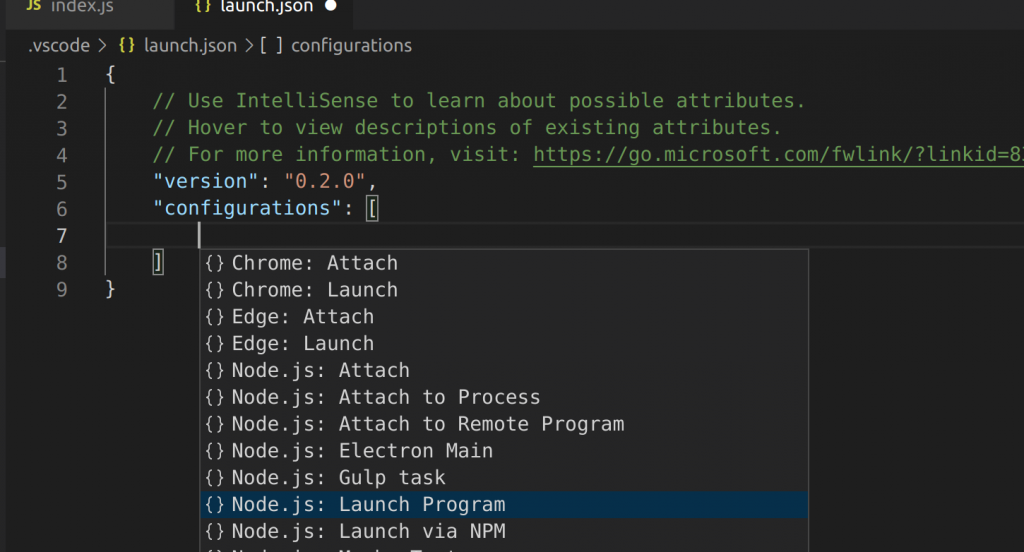
A handy hint, VS Code supports intellisense in launch.json; pressing Ctrl + Spacebar will bring up a list of suggestions which will generate the appropriate entries.
That's really all there is to it. Further documentation on debugging Node in VS Code can be found here, including how to attach rather than launch, and how to configure 'skip files' to avoid certain source files.
Enjoy!